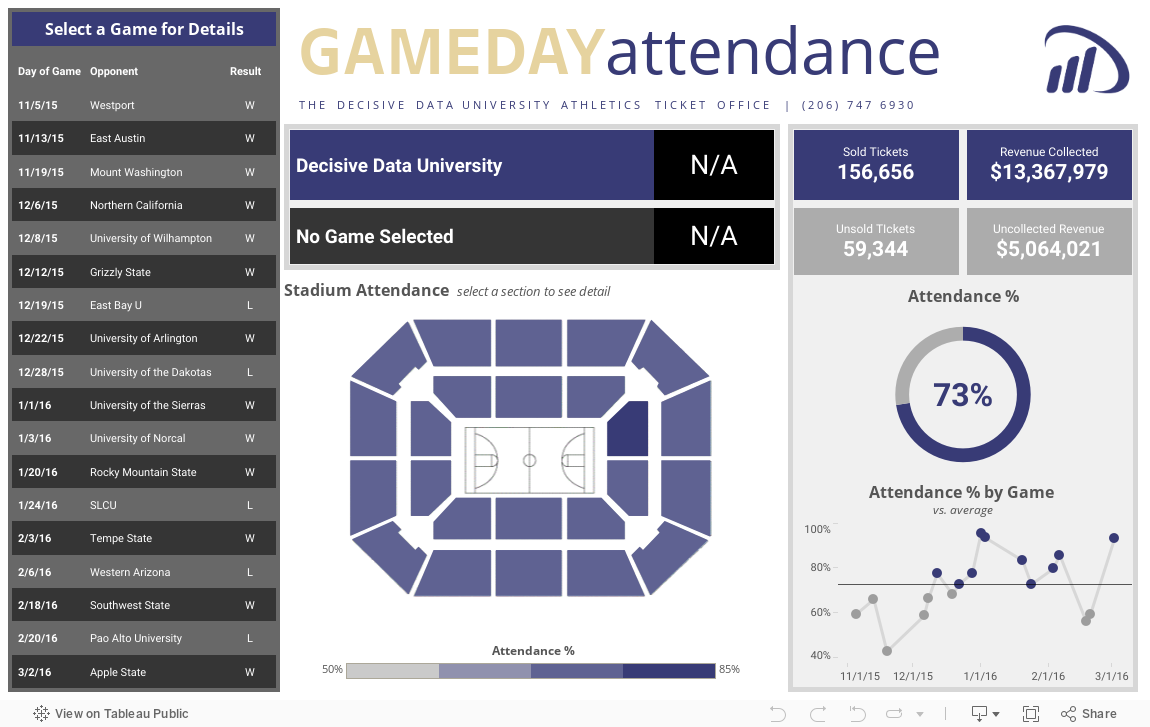
Showing the game-by-game attendance, capacity and revenue of a college stadium, allowing revenue teams to respond to shortfalls, and helping facilities teams resource according to likely attendance.
Imagine running your business with this level of detail
See the full summary, or examine the detail in context.
Interrogate what it shows and experience its full functionality.
Underlying data can be restricted according to users’ permissions or needs and design can be customised to your own brand.

Challenge
In college athletics, revenue-generating teams keep an athletic department afloat. This client sought increased visibility into ticket sales for one of their revenue-generating teams.
The client had the data, but lacked the visual tools required to identify correlations and maximise revenue through ticket sales.
The client had the data, but lacked the visual tools required to identify correlations and maximise revenue through ticket sales.

Solution
We engaged this client in thorough discussions about their data. We identified the metrics they care about most and helps them make connections to how these metrics could contribute to their revenue goals.