
Introduction
When I started my first project with Microsoft back in 2019, I was tasked with creating a report to help a sales team understand when clients had licenses up for renewal and see detailed information about the client’s usage of licenses to help the sales team better optimize agreements with their customer base. The tool was revolutionary for the sales team, which used to pull data from several sources and spend hours making sure it was right. Reports done right can lead to huge efficiencies and make everyone’s jobs smoother, letting us focus on the decisions that truly matter.
The problem
With that project complete, I moved onto a new project with a different team, and then another. Two years later an email popped up from a random employee at Microsoft. He’d found the report I’d built and was asking if I could update it for him. I did a little digging and found that my old team had moved on to a new report, but the old one was still available in their portal and employees could still search for and find the report if they had the proper access. Reports and dashboards across the org had proliferated and no one was taking the time to consolidate them. As a result, people were finding old, not quite deprecated reports and trying to use outdated data to make decisions.
The details
This problem isn’t unique to Microsoft. If you’ve been working with data for long enough, this problem almost certainly applies to you. As people who love data, we want to see insights that are relevant to us and tailored specifically to the way we want to see the data. With multiple teams or levels viewing the same data, this can lead to custom reports for each group that all slice the data slightly differently. When metrics change, these changes don’t always make their way to every report, especially if Dave in accounting (sorry Dave!) created a copy of a report to do his own work. As time goes on, the number of reports keeps expanding and when new team members onboard they don’t know which reports have the right data. This can lead to muddy reporting environments, with reports from years ago that we keep around because we might want to see that data or that visual again someday.
The Solution
Are we doomed to drown in an unending deluge of reports or is there something we can do about it?
- Create report documentation.
Whenever you create a report, you should create documentation that outlines the data sources, the intended audience, and how the report is intended to be used. Documentation for a report overall should be supplemented by a data dictionary that covers the measures or calculations in the report and gives everyone clarity on what is being reported. We often add these as readme tabs or store them in a company wiki. This not only helps with keeping our environments clean, but also helps new users onboard. You will never have to answer the question – “What did we use this report for?”
- Utilize report usage metrics.
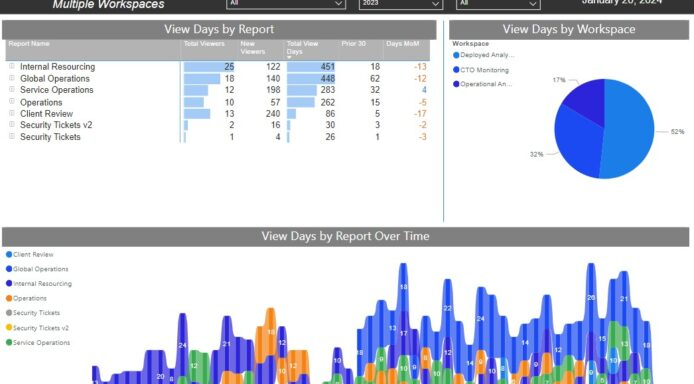
Power BI has built in reports that let you see which reports have been viewed and by whom. Tableau has similar features for Tableau server. We think these reports are so useful we built our own custom report that lets you see usage across workspaces or servers to help you make the decisions on what reports to deprecate. We deployed this in our own environments and for multiple customers.
Interact with the dashboard by clicking on the image below
- Archive reports offline.
Sometimes we don’t want to get rid of reports or need to keep them, but we don’t want them to be available to the organization. In this case, we recommend creating an archive for reports to be kept offline or at least off the workspace or server. These reports should also have accompanying documentation and a data dictionary (thank you, readme tab!)
Closing Remarks
Maintaining your reporting environment hygiene pays dividends in the future and reduces confusion and wasted time. In fact, we saw this as one of our trends for 2023. Curious about the other trends we saw or our predictions about 2024? Watch our Data Transformation Predictions video to see them. We take our reporting work very seriously and our team has the tools and experience to help you with your environment.
For more comprehensive insights into data analytics and visualization, visit https://www.calligo.io


